
![]()
CohortCharacteristics contains functions for summarising characteristics of cohorts of patients identified in an OMOP CDM dataset. Once a cohort table has been created, CohortCharacteristics provides a number of functions to help provide a summary of the characteristics of the individuals within the cohort.
#> To cite package 'CohortCharacteristics' in publications use:
#>
#>   Catala M, Guo Y, Lopez-Guell K, Burn E, Mercade-Besora N, Alcalde M
#>   (????). _CohortCharacteristics: Summarise and Visualise
#>   Characteristics of Patients in the OMOP CDM_. R package version
#>   0.3.0, <https://darwin-eu-dev.github.io/CohortCharacteristics/>.
#>
#> A BibTeX entry for LaTeX users is
#>
#>   @Manual{,
#>     title = {CohortCharacteristics: Summarise and Visualise Characteristics of Patients in the OMOP CDM},
#>     author = {Marti Catala and Yuchen Guo and Kim Lopez-Guell and Edward Burn and Nuria Mercade-Besora and Marta Alcalde},
#>     note = {R package version 0.3.0},
#>     url = {https://darwin-eu-dev.github.io/CohortCharacteristics/},
#> }You can install the latest version of CohortCharacteristics from CRAN:
install.packages("CohortCharacteristics")Or install the development version from github:
install.packages("pak")
pak::pkg_install("darwin-eu-dev/CohortCharacteristics")library(CohortCharacteristics)The package contain three types of functions:
Although the package provides some simple mock data for testing
(mockCohortCharacteristics()), for these examples we will
use the GiBleed dataset that can be downloaded using the CDMConnector
package that will give us some more real results.
library(CDMConnector)
library(duckdb)
library(dplyr, warn.conflicts = FALSE)
folder <- tempdir()
Sys.setenv("EUNOMIA_DATA_FOLDER" = folder)
downloadEunomiaData(overwrite = TRUE)
#>
#> Download completed!
con <- dbConnect(duckdb(), eunomiaDir())
cdm <- cdmFromCon(con = con, cdmSchema = "main", writeSchema = "main")
Let’s create a simple cohort:
library(DrugUtilisation)
cdm <- generateIngredientCohortSet(cdm = cdm, name = "my_cohort", ingredient = c("warfarin", "acetaminophen"))We can get counts using the function
summariseCohortCount():
result <- summariseCohortCount(cdm$my_cohort)
result |>
  glimpse()
#> Rows: 4
#> Columns: 13
#> $ result_id        <int> 1, 1, 1, 1
#> $ cdm_name         <chr> "Synthea synthetic health database", "Synthea synthet…
#> $ group_name       <chr> "cohort_name", "cohort_name", "cohort_name", "cohort_…
#> $ group_level      <chr> "11289_warfarin", "11289_warfarin", "161_acetaminophe…
#> $ strata_name      <chr> "overall", "overall", "overall", "overall"
#> $ strata_level     <chr> "overall", "overall", "overall", "overall"
#> $ variable_name    <chr> "Number records", "Number subjects", "Number records"…
#> $ variable_level   <chr> NA, NA, NA, NA
#> $ estimate_name    <chr> "count", "count", "count", "count"
#> $ estimate_type    <chr> "integer", "integer", "integer", "integer"
#> $ estimate_value   <chr> "137", "137", "13907", "2679"
#> $ additional_name  <chr> "overall", "overall", "overall", "overall"
#> $ additional_level <chr> "overall", "overall", "overall", "overall"
You can easily create a table using the associated table function,
tableCohortCount():
tableCohortCount(result, type = "flextable")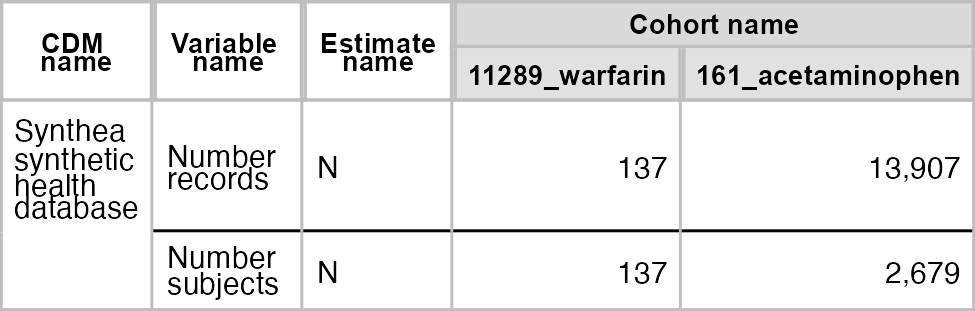
We could create a simple plot with
plotCohortCount():
result |>
  filter(variable_name == "Number subjects") |>
  plotCohortCount(x = "cohort_name", colour = "cohort_name")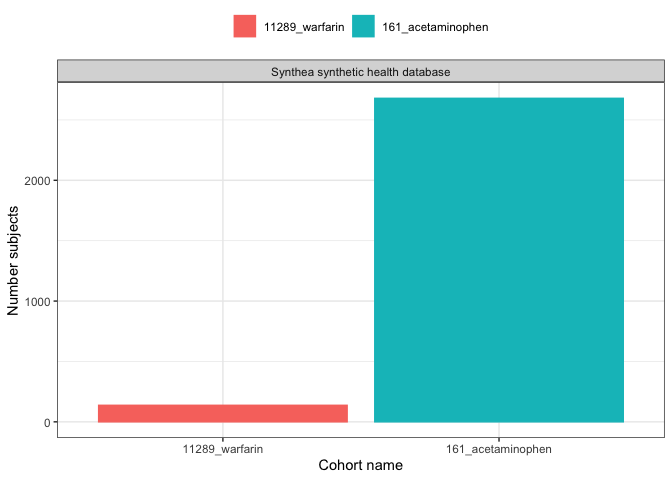
All the other function work using the same dynamic, first
summarise, then plot/table.
result <- summariseCohortAttrition(cdm$my_cohort)tableCohortAttrition(result, type = "flextable")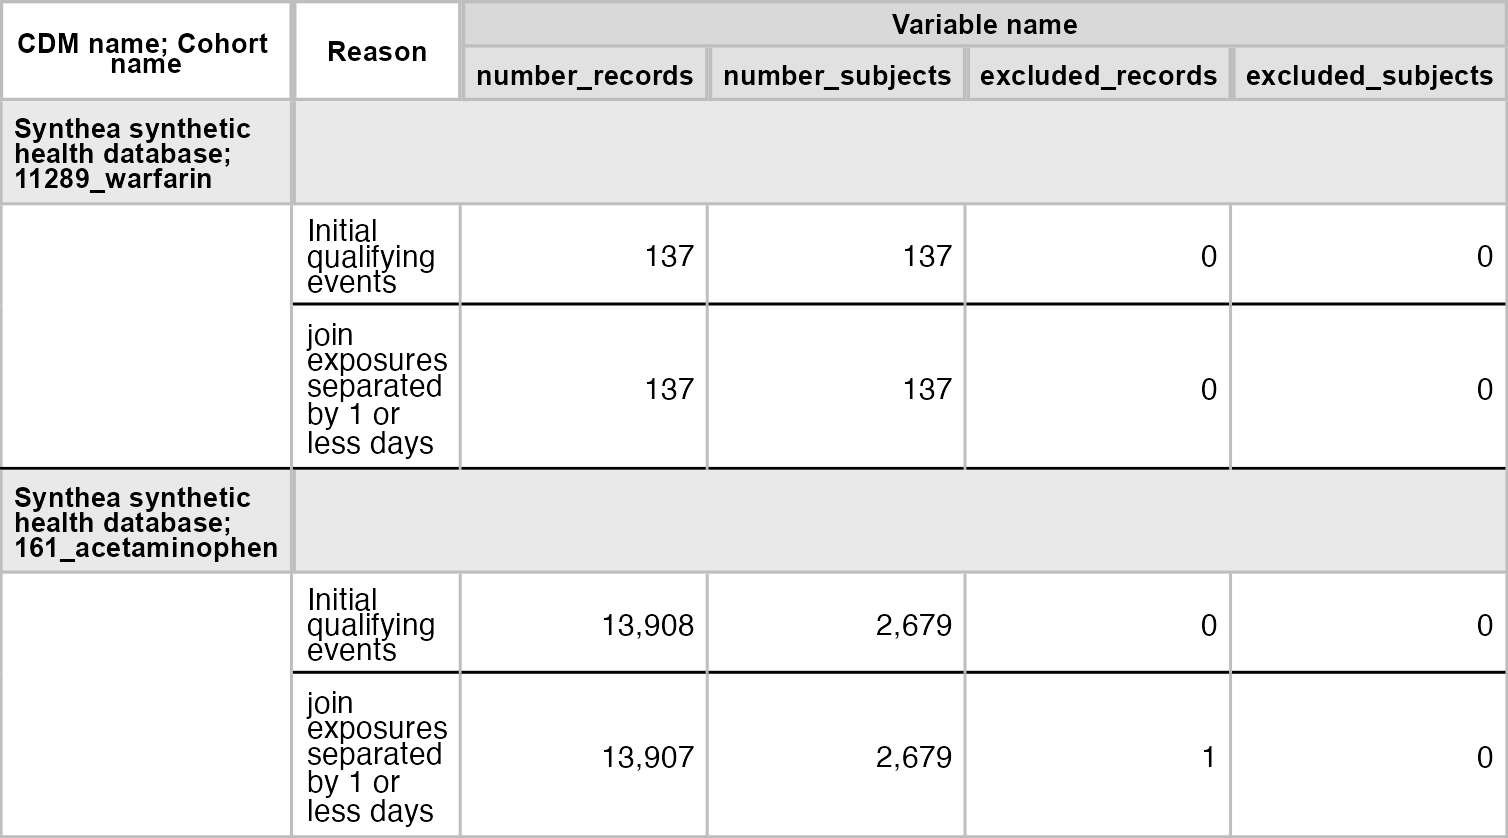
result |>
  filter(group_level == "161_acetaminophen") |>
plotCohortAttrition()result <- summariseCharacteristics(cdm$my_cohort)tableCharacteristics(result, type = "flextable")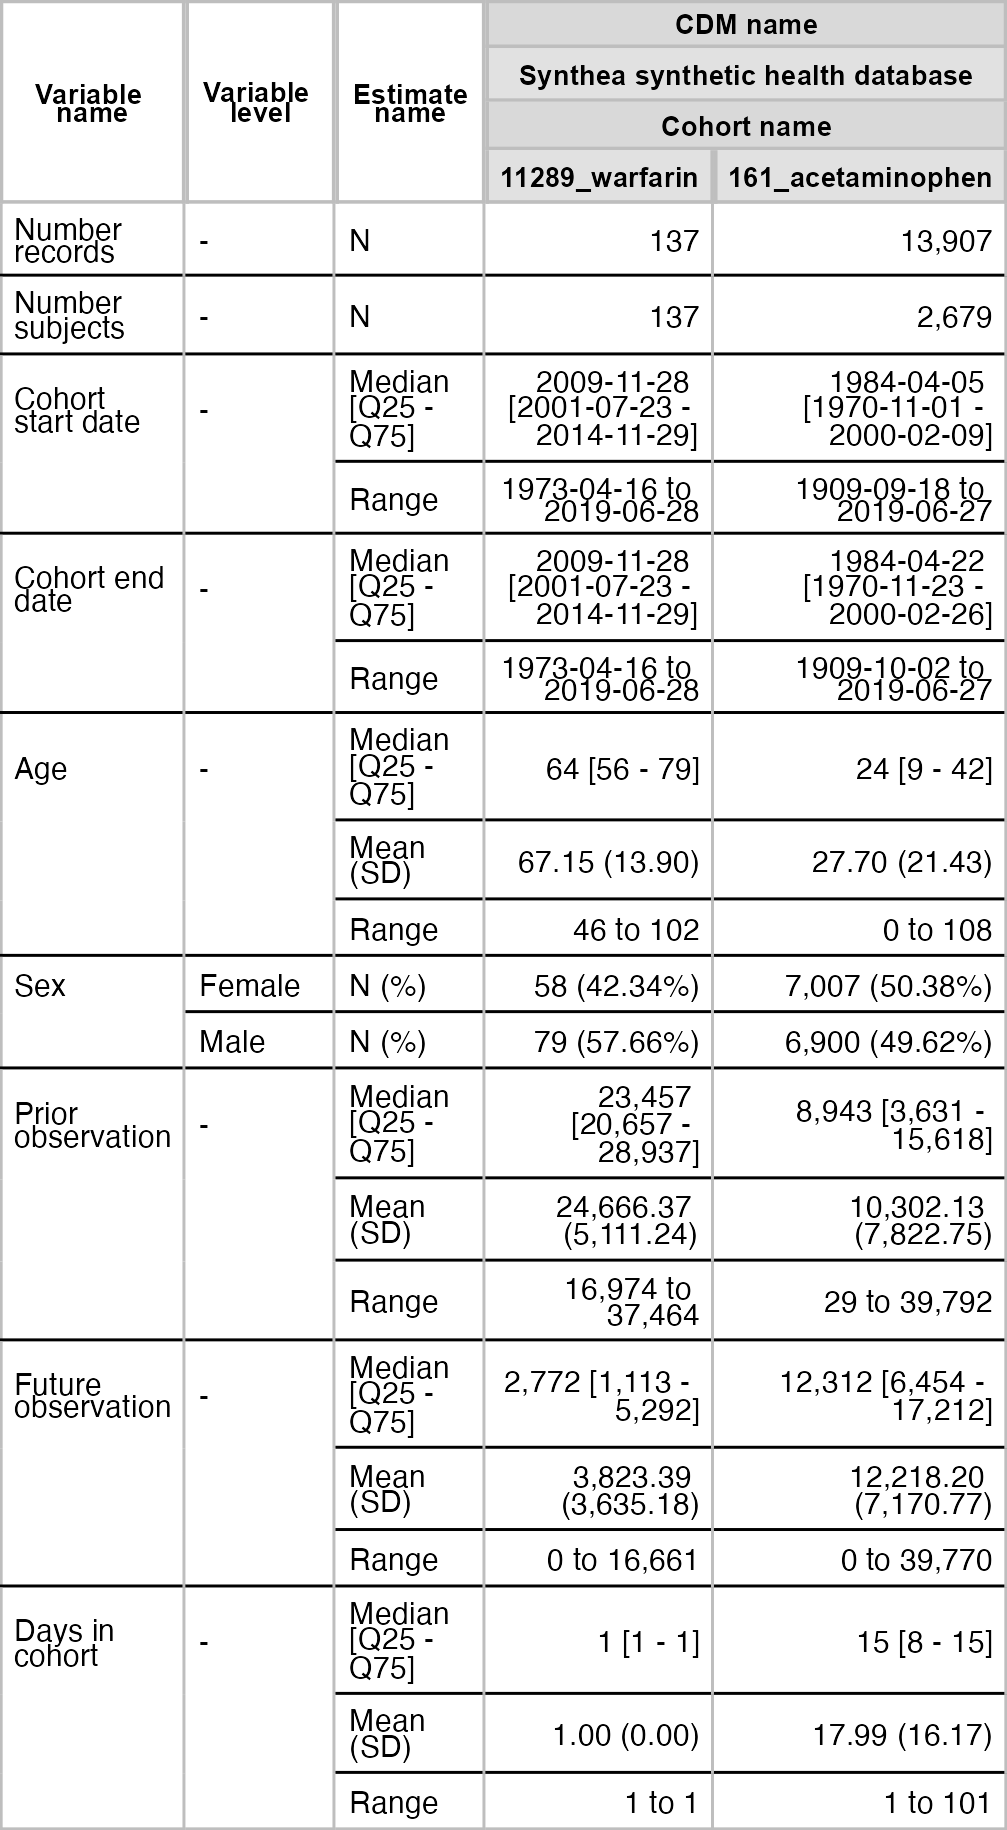
result |>
  filter(variable_name == "Age") |>
  plotCharacteristics(plotStyle = "boxplot", colour = "cohort_name")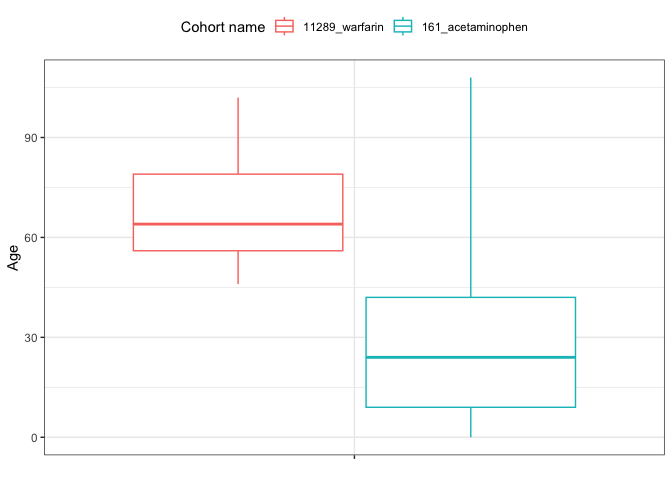
result <- summariseCohortTiming(cdm$my_cohort)tableCohortTiming(result, header = "cdm_name", type = "flextable")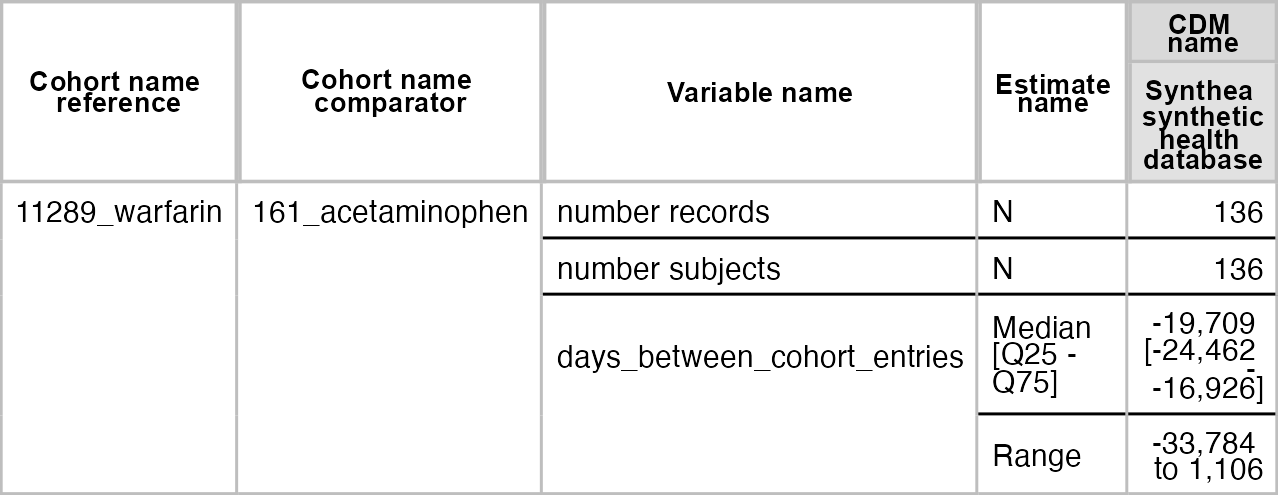
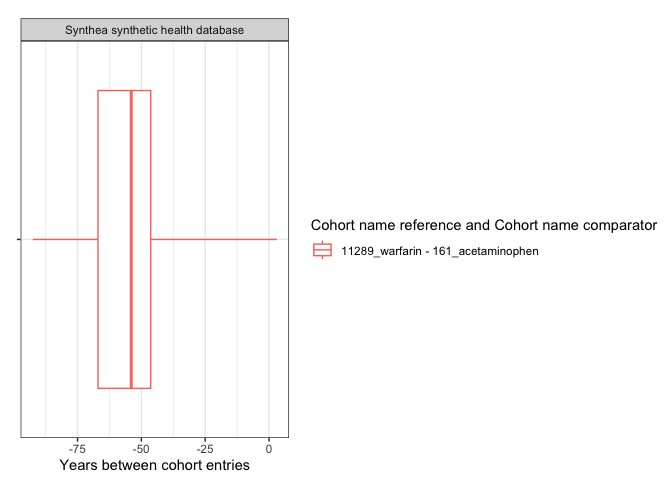
plotCohortTiming(
  result,
  uniqueCombinations = TRUE,
  facet = "cdm_name",
  colour = c("cohort_name_reference", "cohort_name_comparator"),
  timeScale = "years"
)
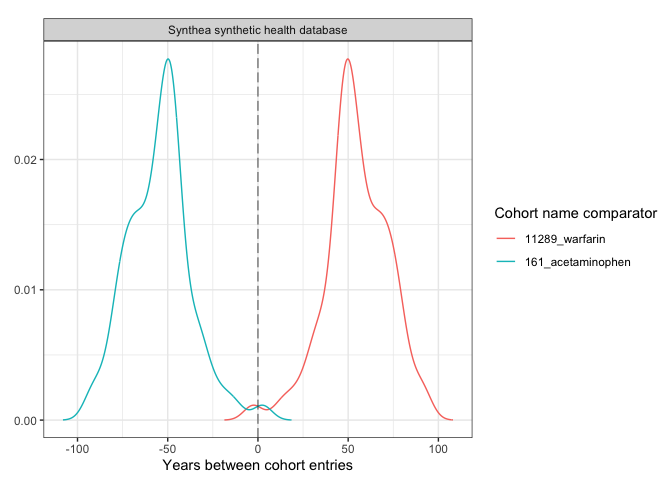
plotCohortTiming(
  result,
  plotType = "density",
  uniqueCombinations = FALSE,
  facet = "cdm_name",
  colour = c("cohort_name_comparator"),
  timeScale = "years"
)
result <- summariseCohortOverlap(cdm$my_cohort)tableCohortOverlap(result, type = "flextable")
plotCohortOverlap(result, uniqueCombinations = TRUE)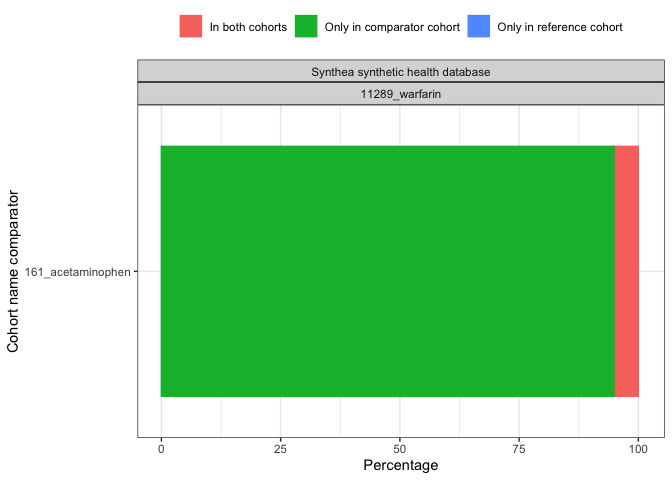
result <- cdm$my_cohort |>
  summariseLargeScaleCharacteristics(
    window = list(c(-90, -1), c(0, 0), c(1, 90)),
    eventInWindow = "condition_occurrence"
)tableLargeScaleCharacteristics(result, type = "flextable")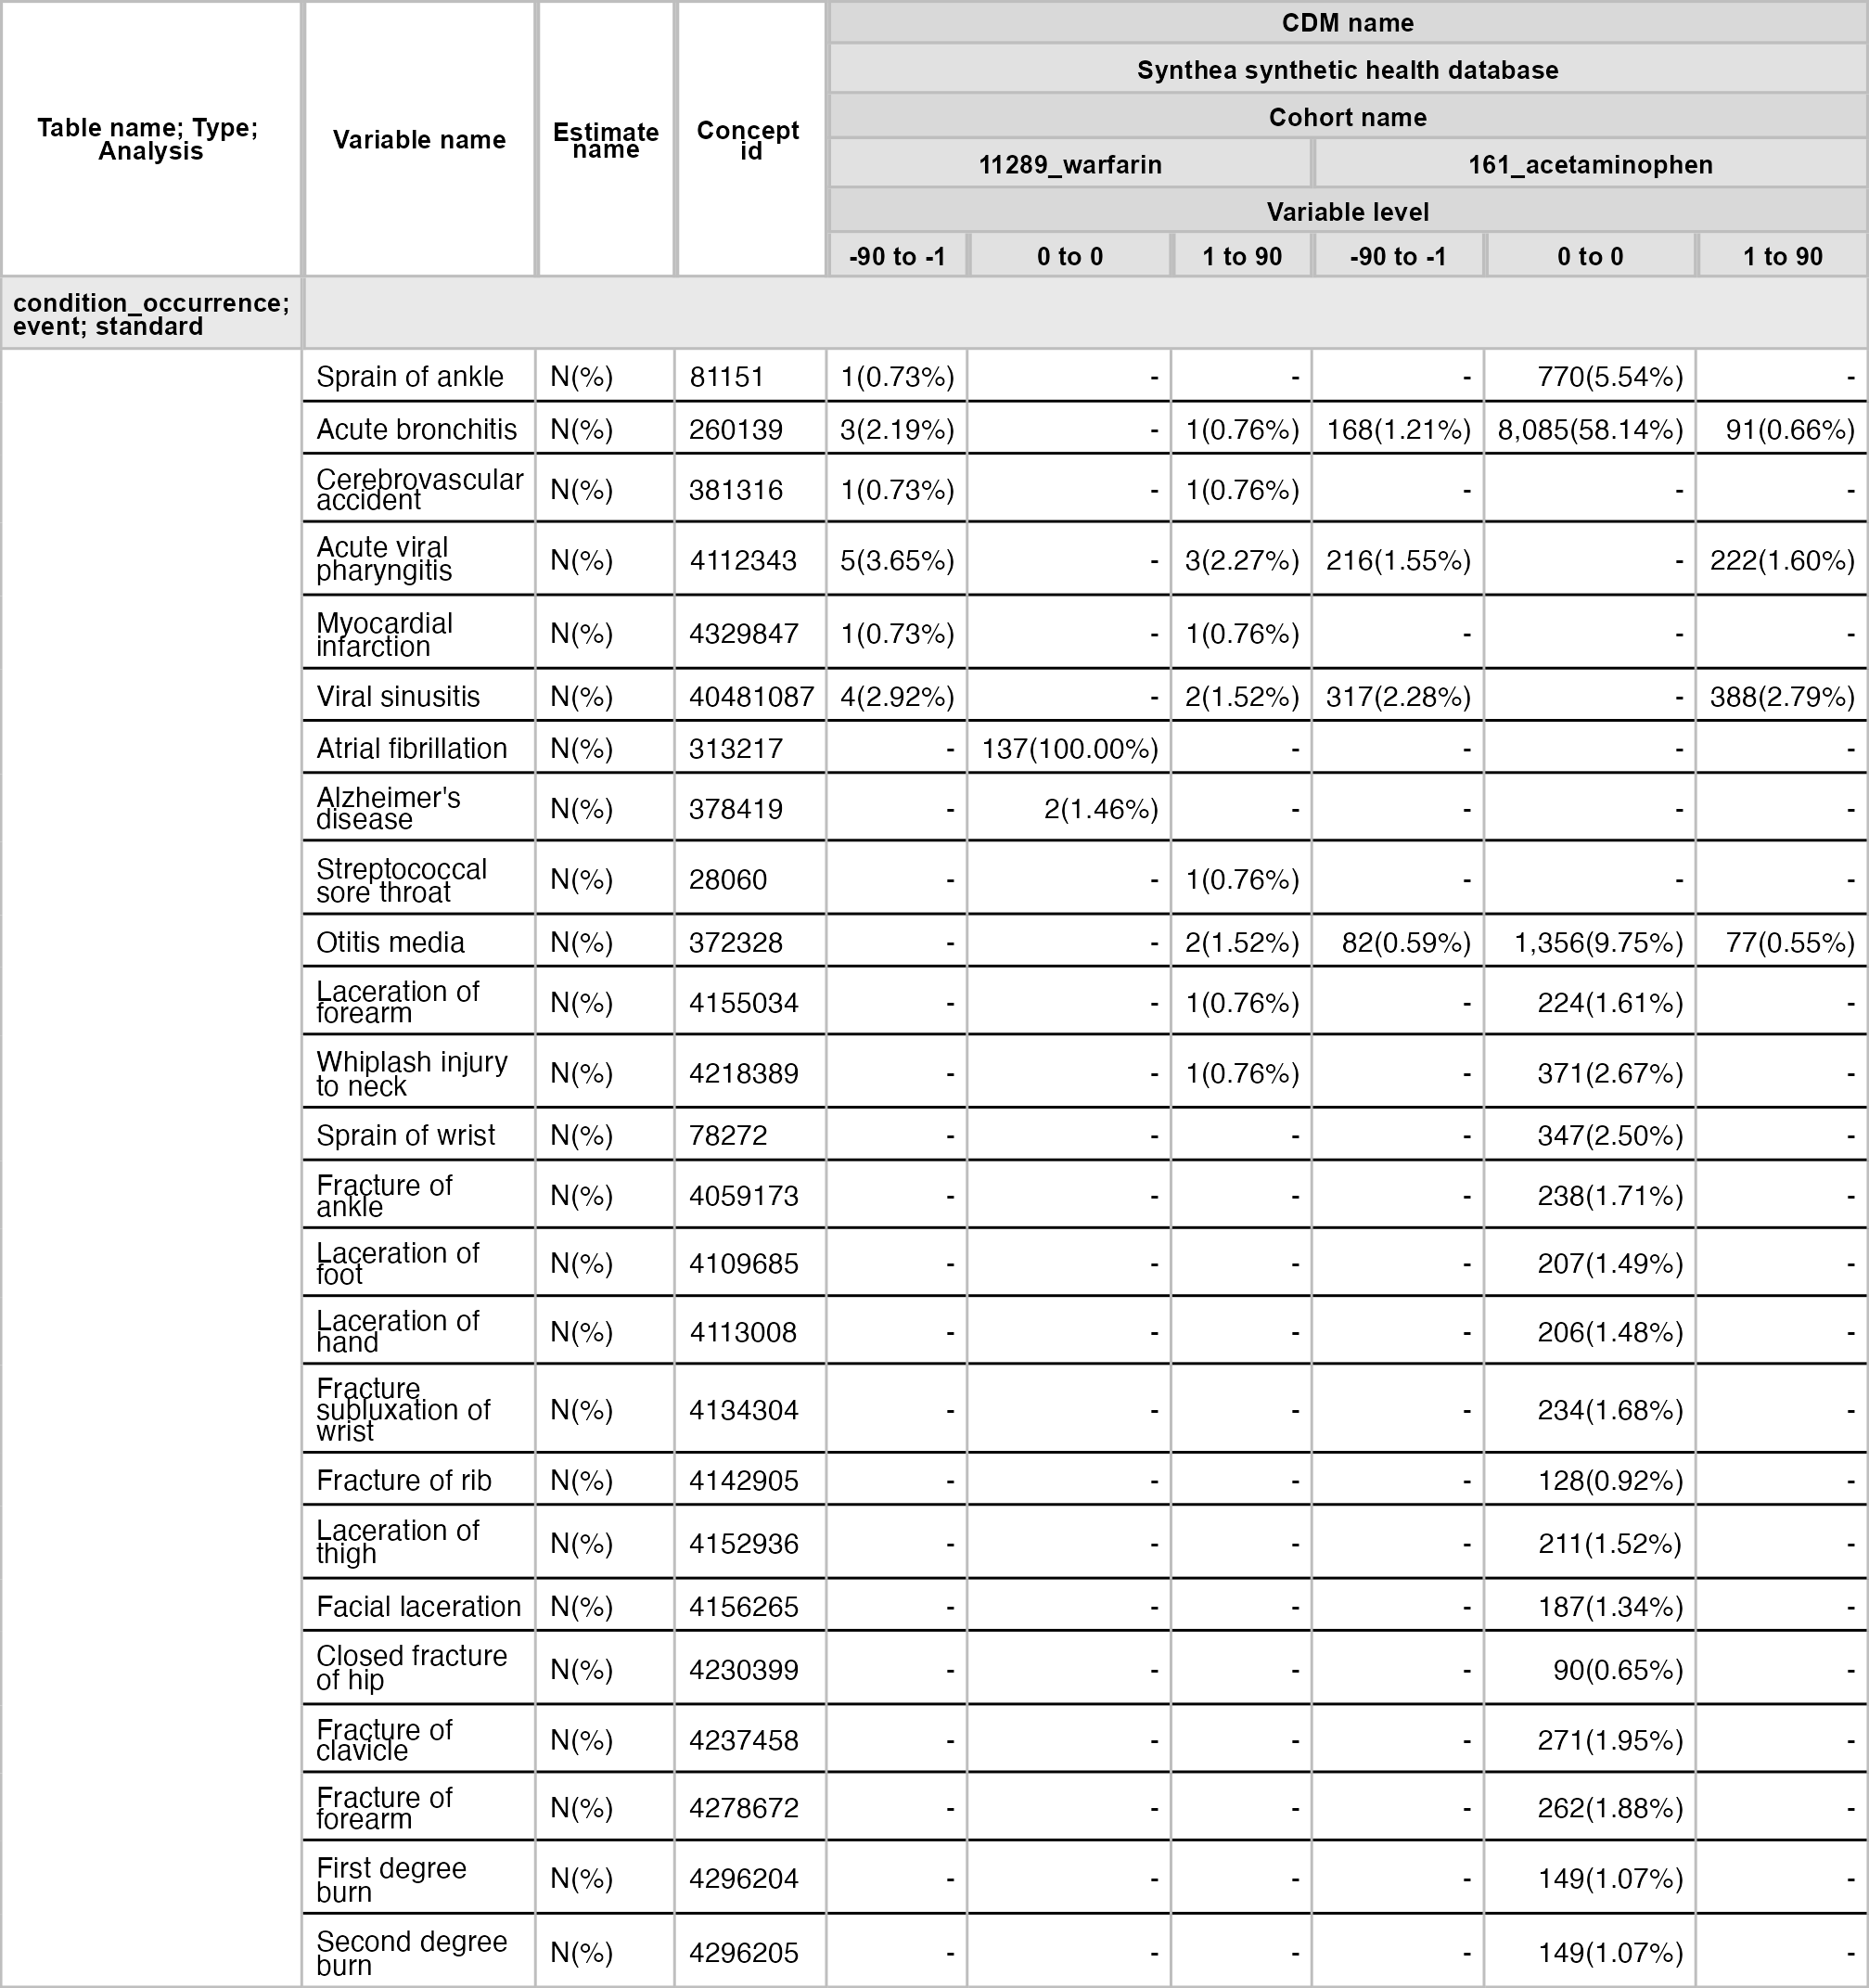
result |>
  filter(group_level == "161_acetaminophen") |>
  plotLargeScaleCharacteristics()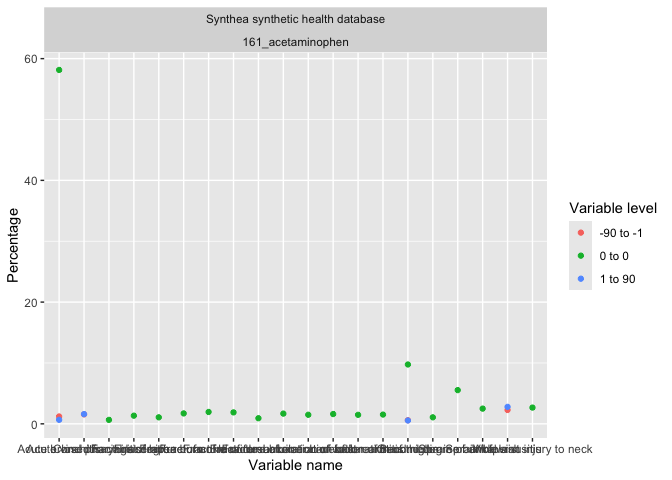
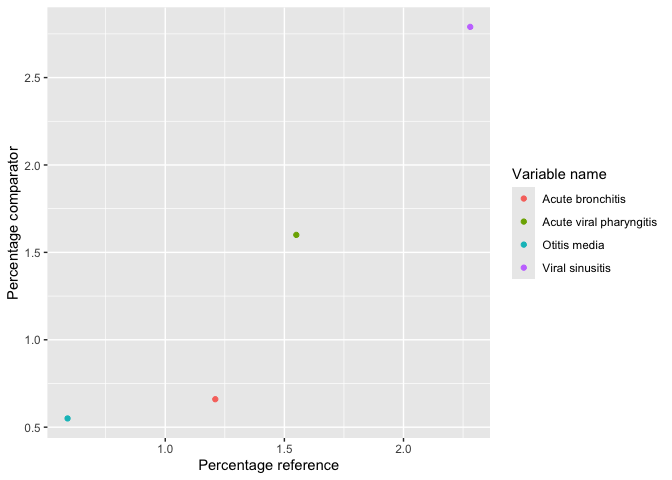
result |>
  filter(group_level == "161_acetaminophen", variable_level != "0 to 0") |>
  plotComparedLargeScaleCharacteristics(
    reference = c(variable_level = "-90 to -1"), colour = "variable_name"
  )
Disconnect from your database using
CDMConnector::cdmDisconnect() to close the connection or
with mockDisconnect() to close connection and delete the
created mock data:
mockDisconnect(cdm)Although it is technically possible, we do not recommend to pipe table or plot functions with the summarise ones. The main reason is that summarise functions take some time to run, a large scale characterisation in a big cdm object can take a few hours. If we pipe the output to a table/plot function we loose the summarise result object. In fact, some times we would send code around to be ran in others database and what we want to export is the summarised_result objects and not the table or plot which we would like to build after compiling results from different cdm objects.
Not recommended:
cdm$my_cohort |>
  summariseCharacteristics() |>
tableCharacteristics()Recommended:
x <- summariseCharacteristics(cdm$my_cohort)

tableCharacteristics(x)